openSAP: Getting Started with Data Science (Edition 2021)
References:
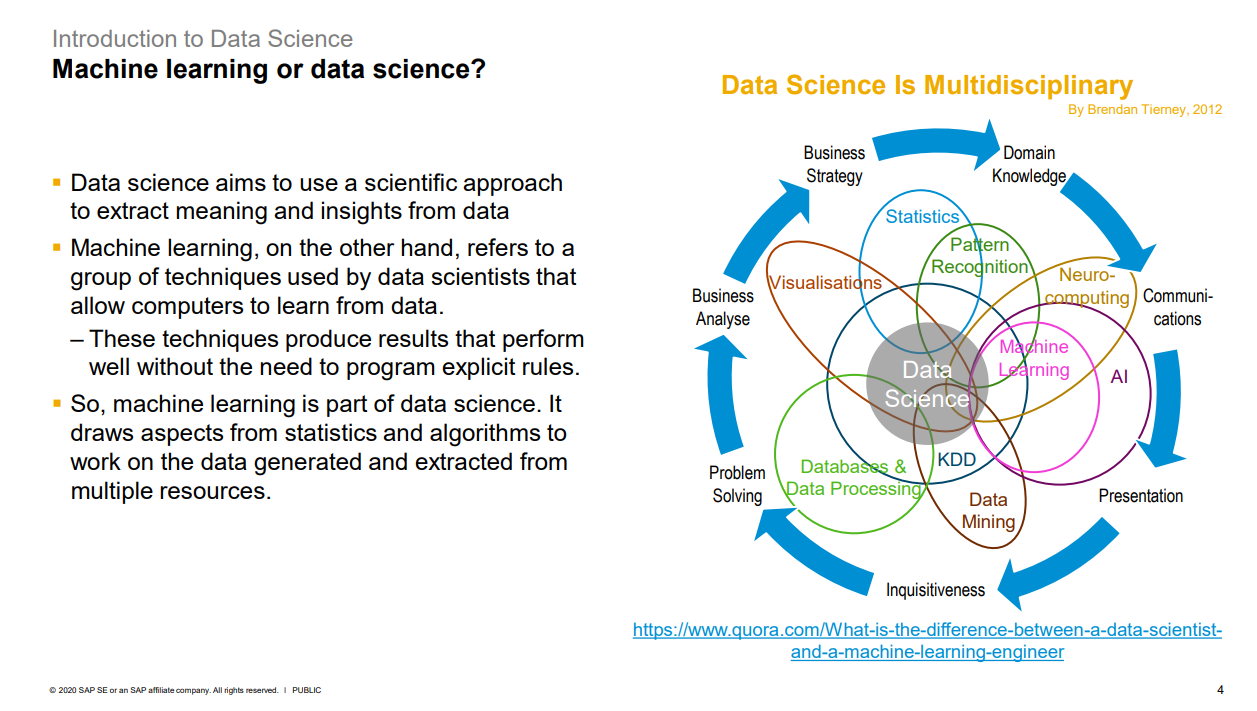
Introduction
SAP HANA Predictive Analysis Library
- Association Analysis
- Classification Analysis
- Regression
- Cluster Analysis
- Time Series Analysis
- Probability Distribution
- Outlier Detection
- Link Prediction
- Data Preparation
- Statistic Functions (Univariate)
- Statistic Functions (Multivariate)

Introduction to Project Methodologies


Phase 1.1: Determine Business Objectives
▪ Task
− The first objective of the data analyst is to thoroughly understand, from a business perspective, what the client really wants to accomplish.
Phase 1.2: Assess Situation
▪ Task
− In the previous task, your objective is to quickly get to the crux of the situation. Here, you want to flesh out the details.
▪ Outputs
− Inventory of resources
− Requirements, assumptions, and constraints
− Risks and contingencies
− Terminology
− Costs and benefits
Phase 1.3: Determine Data Science Goals
▪ Task
− A business goal states objectives in business terminology.
− A data science goal states project objectives in technical terms.
▪ Outputs
− Describe data science goals
− Define data science success criteria
Phase 1.4: Produce Project Plan
▪ Task
− Describe the intended plan for achieving the data science goals and thereby achieving the business goals.
▪ Output
− Project plan with project stages, duration, resources, etc.
− Initial assessment of tools and techniques
Defining Project Success Criteria


▪ The accuracy and robustness of the model are
two major factors to determine the quality of the
prediction, which reflects how successful the
model is.
▪ Accuracy is often the starting point for
analyzing the quality of a predictive model, as
well as an obvious criterion for prediction.
Accuracy measures the ratio of correct
predictions to the total number of cases
evaluated.
▪ The robustness of a predictive model refers to
how well a model works on alternative data.
This might be hold
-out data or new data that the
model is to be applied to. It enables you to
assess how confident you are in the prediction

Initial Data Analysis
Initial data analysis
▪ “Initial data analysis (IDA) is an essential part of nearly
every analysis”
Problem Solving, A Statisticians Guide
Christopher Chatfield
▪ Chatfield defines the various steps in IDA.
It includes
analysis of:
− The structure of the data
− The quality of the data
• errors, outliers, and missing observations
− Descriptive statistics
− Graphs
▪ The data is modified according to the analysis:
− Adjust extreme observations, estimate missing observations,
transform variables, bin data, form new variables
Exploratory data analysis
Exploratory data analysis (EDA) is an approach
to analyzing data for the purpose of formulating
hypotheses that are worth testing. ▪ The objectives of EDA are to:
− Suggest hypotheses about the causes of observed
phenomena
− Assess assumptions on which the analysis and
statistical inference will be based
− Support the selection of appropriate statistical tools
and techniques
− Provide a basis for further data collection through
surveys or experiments

Data Preparation
Phase 3: Outputs
▪ Dataset
‒ This is the dataset (or datasets) produced by the Data Preparation phase, which will be used for
modeling or the major analysis work of the project.
▪ Dataset description
‒ Describes the dataset (or datasets) that will be used for the modeling or the major analysis work ofthe project.
Phase 3.1: Select Data
▪ Task
‒ Decide on the data to be used for analysis.
‒ Criteria include relevance to the data science goals and quality and technical constraints such as limits on data volume or data types.
‒ Note that data selection covers selection of attributes (columns) as well as selection of records (rows) in a table.
▪ Output – Rationale for inclusion/exclusion
‒ List the data to be included/excluded and the reasons for these decisions.
Phase 3.2: Clean Data
▪ Task
‒ Raise the data quality to the level required by the selected analysis techniques.
‒ This may involve selection of clean subsets of the data, the insertion of suitable defaults, or more ambitious techniques such as the estimation of missing data by modeling.
▪ Output – Data cleaning report
‒ Describe what decisions and actions were taken to address the data quality problems reported during the Verify Data Quality task of the Data Understanding phase
Phase 3.3: Construct Data
▪ Task
‒ This task includes constructive data preparation operations such as the production of derived attributes, entire new records, or transformed values for existing attributes.
▪ Output – Derived attributes
‒ Derived attributes are new attributes that are constructed from one or more existing attributes in the same record. Examples: area = length * width.
▪ Output – Generated records
‒ Describe the creation of completely new records.
Phase 3.4: Integrate Data
▪ Task
‒ These are methods whereby information is combined from multiple tables or records to create new records or values.
▪ Output – Merged data
‒ Merging tables refer to joining together two or more tables that have different information about the same objects.
‒ Merged data also covers aggregations.
Phase 3.5: Format Data
▪ Task
‒ Formatting transformations refer to primarily syntactic modifications made to the data that do not change its meaning but might be required by the modeling tool.
▪ Output – Reformatted data
‒ Some tools have requirements on the order of the attributes, such as the first field being a unique
identifier for each record or the last field being the outcome field the model is to predict.
Predictive Modeling Methodology – Overview
\Sometimes when you design a model, you might want to build in a “latency” period.
Many datasets used for predictive modeling have the following structure:
▪ Historic Data: (in the past, compared to the reference date) with dynamic data computed in relation to the
reference date. Usually short-term, mid-term, and long-term indicators.
▪ Latency Period: (starting after the reference state) a period where no data is collected. This is used to
represent the time required by the business to collect new data, apply the model, produce the scores, and
define the campaign. Not all predictive models require a latency period, although many churn models will.
▪ Target: (starting after the reference state + latency period) a period where the targeted behavior is
observed.
Data Manipulation
The first step is to identify the “entity” for the analysis.
− An entity is the object targeted by the planned analytical task.
− It may be a customer, a product, a store, etc., and is usually identified by a unique identifier.
− The entity defines the “granularity” of the analysis.
The analytical record is a 360o view of each entity, collecting all of the
static and dynamic data together that can be used to define the entity.
Binning is one of the fundamental feature engineering techniques.
▪ The original data values which fall into a given small interval, a bin, are replaced by a value representative
of that interval, often the central value.
When you know that there can be multiple
entries for one individual in a transaction table,
for example, you have to compute an
aggregate to avoid creating duplicates in your
dataset.
Data Encoding
The data encoding process prepares missing values
in the data, deals with outliers, and creates data bins
or bands to transform raw data into a “mineable”
source of information.
Selecting Data – Variable and Feature Selection
“Feature selection” is the process of selecting a subset
of relevant explanatory variables or predictors for use in
data science model construction.
▪ It is also known as variable selection, attribute selection,
or variable subset selection.
▪ Often, data contains many features that are either
redundant or irrelevant, and can be removed without
incurring much loss of information.
▪ Remember that domain knowledge can be the best
selection criterion of all!!
Backward elimination
1. Backward elimination starts with all candidate features.
2. Test the deletion of each feature using the chosen
model comparison criterion, deleting the feature (if any)
that improves the model the most by being deleted.
3. Repeat this process until no further improvement is
possible.
orward selection
1. Forward selection starts with no features in the
model.
2. Test the addition of each feature using the chosen
model comparison criterion.
3. Add the feature (if any) that improves the model the
most.
4. Repeat this process until no other feature additions
improve the model.
Classification Analysis with Decision Trees
Strengths
– The tree-type output is very visual and easy to understand
– They are able to produce ‘understandable’ rules
– They can perform classification without requiring much computation
– They can handle both continuous and categorical variables
– They provide a clear indication of variable importance
▪ Weaknesses
– Clearly sensitive to the ‘first split’
– Some decision tree algorithms require binary target variables
– They can be computationally expensive
– They generally examine just a single field at a time
– They are prone to over-fitting
Classification Analysis with KNN, NN, and SVM
Strengths
‒ They can handle a wide range of problems
‒ They can produce good results even in complex non-linear
domains
‒ They can handle both categorical and continuous variables
▪ Weaknesses
‒ Black box – hard to explain results
‒ NNs need large amounts of data
‒ Computationally expensive
‒ Potential to over-fit
‒ No hard and fast rule to determine best network structure
Time Series Analysis
Stationary, trend, and seasonality
Comments
Post a Comment